Enriching the Haystack for Better Biotech
What can we learn from evolution and, more importantly, when can we outperform it?
Today we're talking about fitness distributions and what they can teach us about making biology easier to engineer.
Transcript
Evolution is pretty good at making stuff. Very good, some would say. Evolutionary biologists have some useful models to describe how the magic happens. We synthetic biologists can borrow some of those ideas for our biotech R&D programs.
Today, the idea I want to borrow is called the Distribution of Fitness Effects.
Let's start from the beginning. Evolution, as we all know, is a process of mutation and selection. DNA sequences mutate, essentially at random. Some of those mutations are harmful, many of them are neutral, and a few of them are beneficial. In evolution, beneficial means they help to replicate the DNA that codes for them.
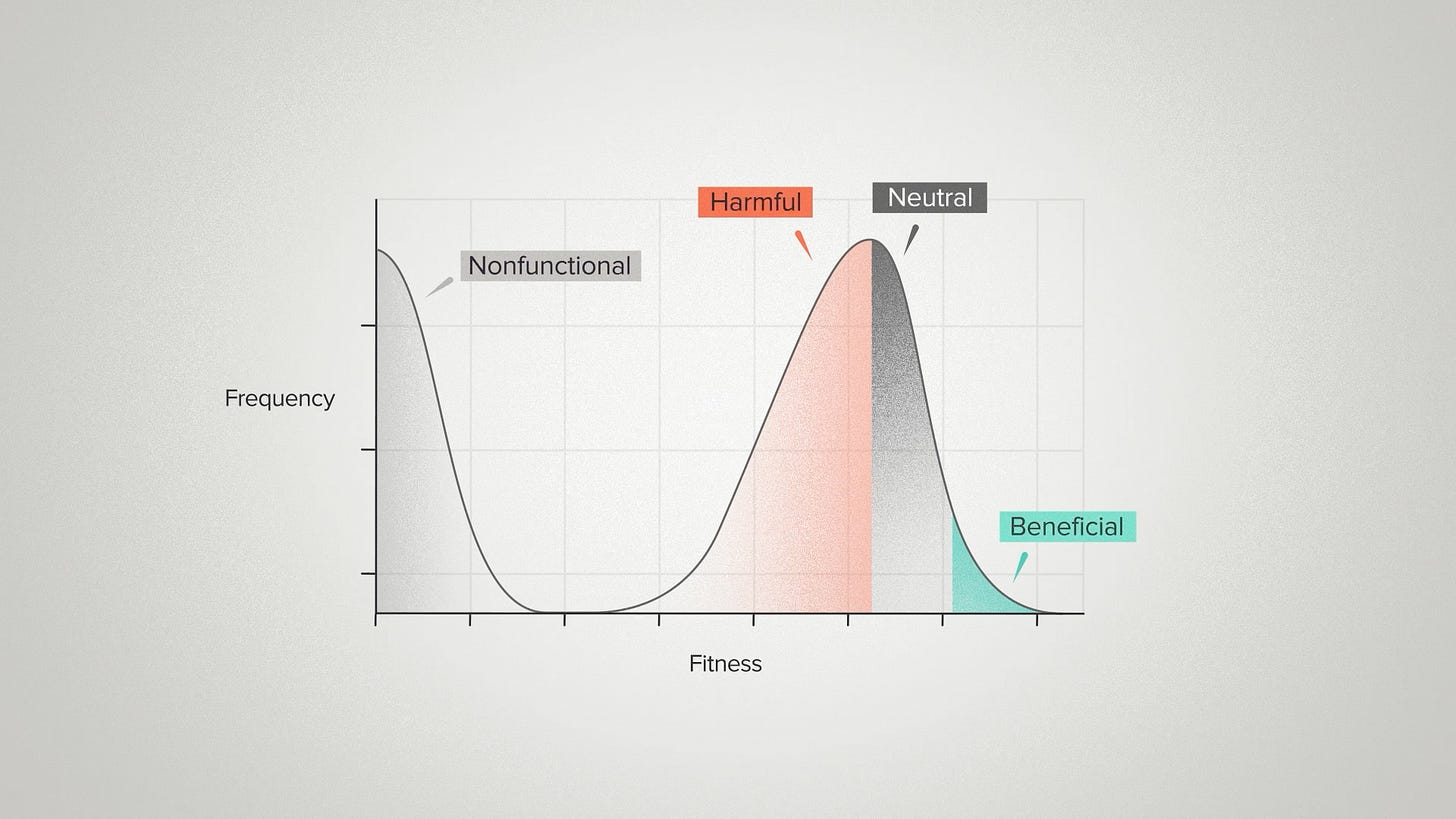
The Distribution of Fitness Effects is a way of visualizing these different possible outcomes. What if we took a large number of random mutations and measured the fitness effect of each one. What would that look like as a probability distribution?
Here's a typical example. Down here you have the most harmful mutations. These are the ones that break the system completely and kill the host. Then you see a big, meaty part of the curve for mutations that are mildly deleterious or neutral. The distribution drops off sharply once you get into the positive region. Beneficial mutations are rare and they get rarer the more beneficial they are.
This graph probably matches your intuition about what happens when you make changes to a complex system. It's easy to break something. It's easy to do nothing. It's hard to make things work better.
Obviously, the details of the curve vary depending on what, exactly, is being mutated. But the big picture is pretty consistent. You can find similar curves for mutations in enzymes, in RNA molecules, in whole plant genomes, in microbes or mammalian cells.
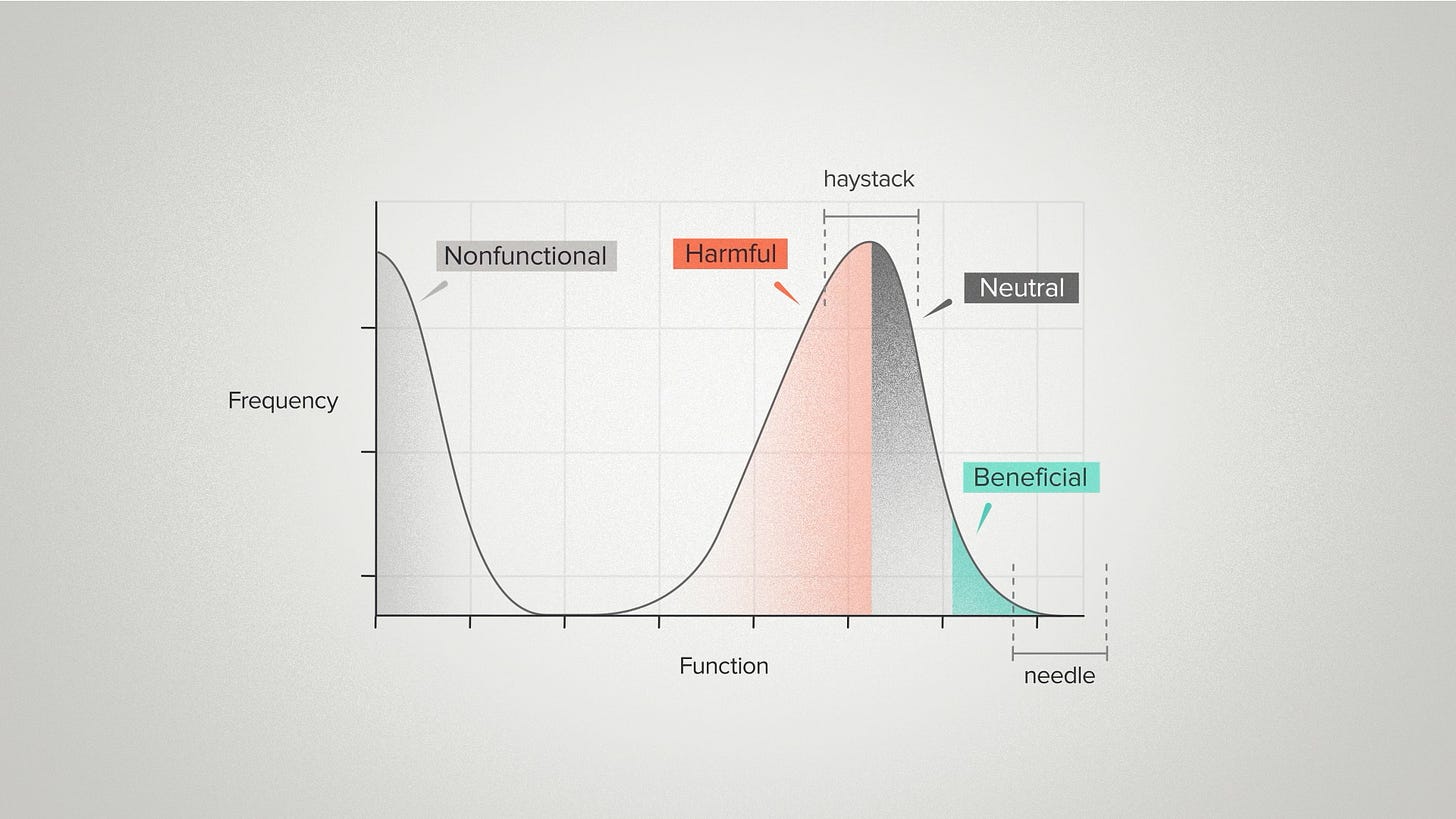
Nothing in biology is universal. But this is common enough that it's fair to assume this curve will probably apply to any biological system you want to engineer. And we can generalize it still further to distributions other than fitness effects. This could be the distribution of function effects for a piece of engineered biology. If we can measure the function, we can put it on a graph.
Maybe what you want is an enzyme for chemical manufacturing. This could be the catalytic rate.
Maybe you want an RNA therapeutic. This could be a measure of clinical efficacy.
Maybe you want a microbe that makes a natural pesticide for agriculture. This could be the fermentation titer.
The distribution of function effects helps us visualize some key features of a biotech R&D program.
First of all, it depicts the scale of the challenge. There's a lot of useless DNA sequences out there. Effectively, an infinite number. You often hear the metaphor of a needle in a haystack. Well here's your needle and here's your haystack.
Second, it represents the opportunity. Over here on the good side of the distribution, we often see a long tail at the high end. This is a detail that the haystack metaphor often misses. There's more than one needle in here. Some DNA sequences are better than others and the better they are, the harder they are to find.
Finally, a function distribution shows the value added by a foundry like Ginkgo when you partner with us for your R&D program. As the technology for designing DNA sequences gets better, as it definitely is, it can create the misleading impression that design alone is the answer. There's a risk of over-indexing on the goal of a single perfect design.
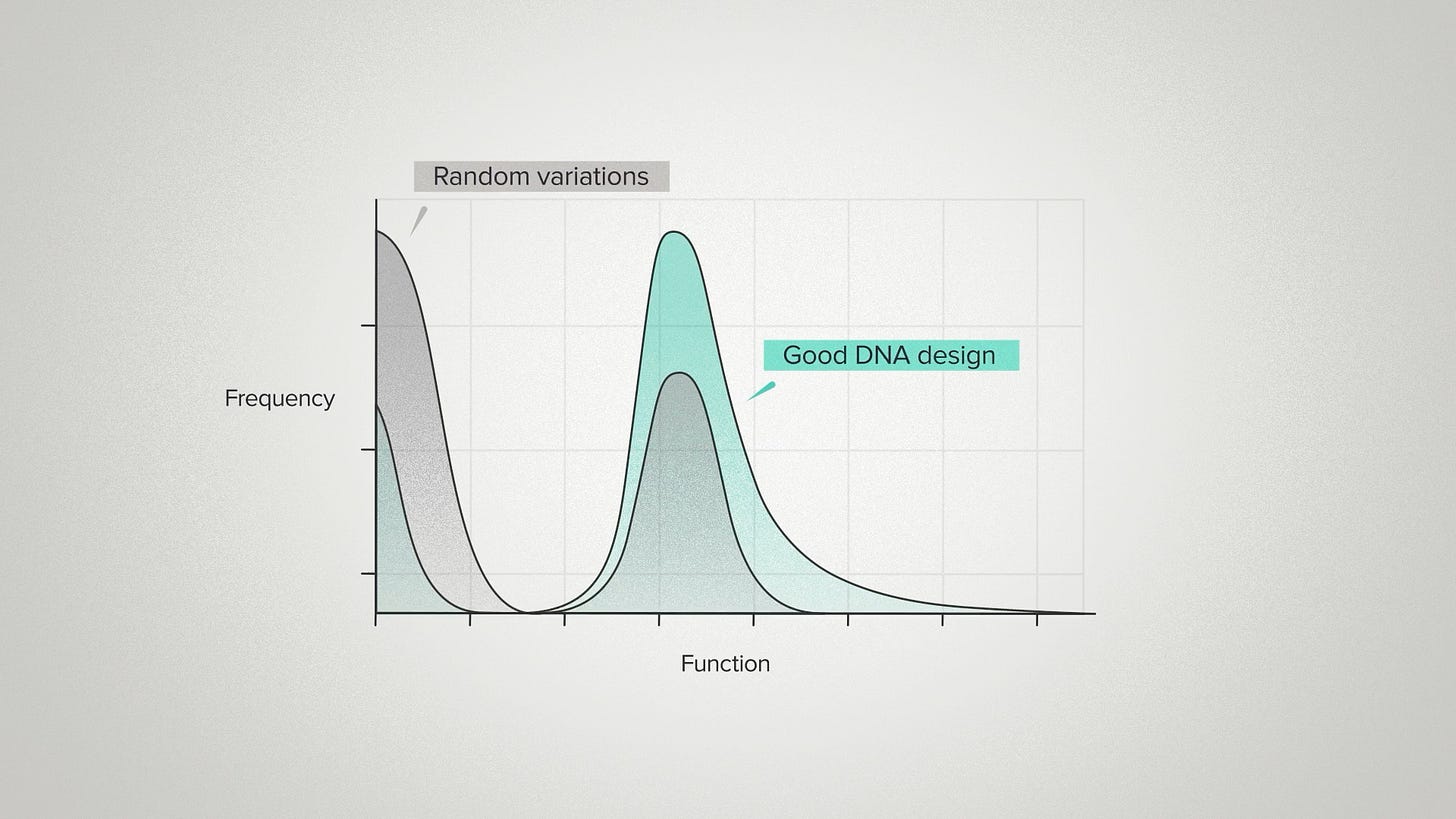
But what we really want to do is reshape the entire curve. We started with a baseline distribution of random sequence variations, similar to the random mutations in evolution. Good DNA design means we can be much smarter than that.
For example, we can choose to make mutations to just the active site of an enzyme, where they're more likely to have an effect. We can model the 3D structure of an RNA molecule, then make changes that preserve the core folding. More recently, we can use generative AI, trained on DNA sequences with a desired functional property, to produce new sequences that are much more likely to have that property.
These smart design strategies mean that, on average, we find fewer nonfunctional sequences and more high performers. You can think of it as enriching our haystack to have more needles. You can think of it as pushing the function effects curve to the right. The average performance goes up and the peak performance goes up, but we are still fundamentally drawing from a probability distribution. So we still benefit from being able to build many different DNA sequences, if our goal is to find the best of the best.
The take-away message from function effect distributions in biotech R&D is that smart design and smart scale work together. As we get better at designing DNA sequences, it doesn't eliminate the need to test those designs to reveal the top performers.
Like evolution, engineering biology is still a process of mutation and selection. For the best outcomes, we want to enhance both sides of that process. We want the AI-guided design tools for generating new DNA sequences and the foundry infrastructure to test them at scale.


